Global Journal of Fisheries and Aquaculture received 294 citations as per Google Scholar report

Received: 14-Jan-2022, Manuscript No. GJFA-22-46882; Editor assigned: 17-Jan-2022, Pre QC No. GJFA-22-46882(PQ); Reviewed: 31-Jan-2022, QC No. GJFA-22-46882; Revised: 14-Mar-2022, Manuscript No. GJFA-22-46882(R); Published: 21-Mar-2022, DOI: 10.15651/2408-5464.22.10.001
Lake Koka is one of the main fish production sites in Ethiopian Rift Valley. The status of fish production activities in a lake determines the socio-economic role and sustainability of the fishery in the area. The present study focused on the assessment of production system, socio-economic importance and current status of fish production activities around Koka Lake using cross-sectional research design and mixed research approach. The primary data were collected from 172 fishing households through structured questionnaire with simple random sampling techniques and additional key informant interviews and focused group discussions while, secondary data were carefully collected from district office and all necessary sources. The collected data were analyzed using descriptive statistics. Based on the assessment results, Oreochromis niloticus, Clarias gariepinus and Cyprinus carpio were the dominant and targeted species in overall fish production of Koka Lake. Fishing activities were performed during morning and at night time using non-motorized traditional boats and gillnet fishing equipment’s. The fishermen were full time (68.6%) and seasonally (31.4%) engaged workers using the fish as main livelihood income source and for home consumption. Majority of the fishermen had no access to training of fishery technologies and credit services. Almost all fishing households sell their products at the fish landing sites and at nearest village markets without adding value to their products. Based on trend analysis, fish production in the lake fluctuated from season to season and show declining trend in production at several fish landing sites. So, special attention should be given by all concerned bodies to improve fishing activities through intensive follow up with supporting implementation of appropriate fishery technologies and information.
Fishermen, Fish production, Lake Koka
From global fish production of 171 million tons, capture fisheries represented about 90.63 million tons, which covers 53% from the total fish production (FAO, 2018). In developing countries, the livelihoods of more than 500 million people are directly or indirectly tied with fisheries (Brander, 2010). Historically, Africa’s fisheries are increasingly contributing to food and nutrition security, foreign exchange, employment, and livelihood support services (De Graaf and Garibaldi, 2019). The New Partnership for Africa’s Development (NEPAD) estimates that total fishery production in the region stands at 10.4 million tons (NEPAD, 2014) comprising of 6.0 million tons from marine capture fisheries, 2.8 million tons from inland water fisheries, and about 1.6 million tons from aquaculture.
In African continent, about 12.3 million people work in the fisheries sector, with 6.1 million (50%) being employed as fishers, 5.3 million (42%) as processors and 0.9 million (8%) as fish farmers (De Graaf and Garibaldi, 2019). In Africa, in terms of economic value, fish produces an estimated total of US$24 billion annually, accounting for 1.26% of gross domestic product (GDP) (NEPAD, 2014). As compared to the marine fishery, inland fisheries of Africa have 2.1 million tons of fish (Tilahun et al., 2016) which has become a major export item for Africa with an annual export value of $2.7 billion (Olaoye et al., 2013).
Ethiopia’s fisheries are entirely fresh water, in its many lakes, rivers and reservoirs; as the country has no marine coastline for production potential. Ethiopia produced lower fish than the country's production potential that several reasons attributed to the low production; among them lack of fishing tradition and low fish consumption habit of most people were frequently quoted. Traditionally, small-scale or artisanal fisheries are used to characterize those fisheries that were mainly non-mechanized with low level of production due to constraints faced by the fishermen (Adewwumi et al., 2012).
Even though, the economic importance of fish farming at the household and national level is significant, performances of fishing households were different because of fishing with different production methods. The findings of this study bring updated information on the current situation of fishery of Lake Koka that can help for proper intervention in production practices. Therefore, principal objectives of the study ware to assess fisheries socioeconomic importance and the current status of fish production activities in Lake Koka around Lume district.
Description of the study area
The study was conducted in Lume administrative district around Lake Koka (Figure 1), a Lake in Awash River Basin. The lake is situated at around 90 kilometers southeast of Addis Ababa. Administratively it is found in Oromia Regional State, between East Shoa Zone (between Lume and Bora district), and Arsi Zone (bordered with Dodota district) (Lume District Livestock Development and Fishery Office, 2020). At Lume district, the Koka is used for different economic and ecological purposes [1].

Figure 1. Map of Lake Koka (Adopted from Derribew et al., 2020).
There are two rivers namely Awash and Mojo that flow towards the lake as inlet Rivers. The Lake has a surface area of about 255 km2 with a maximum depth of 14 m.The mean depth of the lake is around 9 m with shore line of 195-205 km distance. It is located between 802´ to 8026´N latitude, 390 to 39010´E longitude and an altitude elevation of 1660 meters above sea level. Awash and Mojo Rivers are the inflowing rivers to the Lake. Its water in- and outflow is mainly provided by the Awash River. The lake is serving for different purposes, such as hydroelectric power generation and from small to large irrigation. The lake is also important for fishing activities (Ann Gorfon et al., 2007) that mainly used by people living in the vicinity of the lake [2].
Sampling procedure and method of data collection
This study was used the cross-sectional research design that focus on both qualitative and quantitative nature of data. The study employed simple random selection procedures to identify the sample households who are using fish as the sources of livelihood. The primary data were collected using structured questionnaire interview, focus group discussion and field observations. Secondary data were also collected through review of relevant literatures. The total of 172 respondents was participated in the study for primary data generation who were randomly selected from fishing households. Through interview schedule data related to household demographic profile, socio-economic status and status of fish production were collected from sampled farmers [3].
As Key Informant Interviews (KIIs) fishery cooperative leaders, local level officials and fishery experts who lived and served with the locality were used for additional data generation. Focus group discussion (FGD) also held that helps to generate data on group dynamics, and allows a small group of respondents to guide by moderator, to focus on key issue of the research objective. A total of two groups were organized and the main purpose of focus group discussion was to explore the important and dominant fish species in the catch, nature of fishing and major fishing activities, types of fishing gears used, fishing challenges, marketing and selling activities [4-10].
Socio-demographic profile of fishing communities
From survey result the household were dominated by Orthodox Christian religion followers who constitute about 62.21% from the sample respondents (Table 1). For this religion follower fish is a very critical food item during feasting days and season. They prefer to eat fish in the restaurant and home when other animal meat is not allowed to use. The religion of the remaining 15.12%, 19.19% and 3.49% of the total sample households were Wakefeta, Protestant and Muslim follower respectively [11].
Regarding to educational status, the data show that about 43.6% of households were uneducated while 35.47% of the sampled respondents were attended from primary to high school. From the total respondent about 20.93% of sampled household heads were able to read and write through adult education and religious schools (Table 1).
| Variables | Category | Frequency | Percentage |
|---|---|---|---|
| Orthodox Christian | 107 | 62.21 | |
| Religion | Protestant | 33 | 19.19 |
| Wake feta | 26 | 15.12 | |
| Muslim | 6 | 3.49 | |
| Uneducated | 75 | 43.6 | |
| Educational status | Able to read and write | 36 | 20.93 |
| Primary | 45 | 26.16 | |
| High school | 16 | 9.3 |
Table 1: Religion and educational status of households.
The mean age of the sample household’s heads was 37.18 years with maximum and minimum age of 57 and 19 years respectively (Table 2). The mean household family size was collected continuously and calculated with adult equivalent ratio. Based on Table 1 the mean household size were 4.7 with the maximum and minimum of 10.6 and 1 persons respectively.
| Variables | Mean | Minimum | Maximum |
|---|---|---|---|
| Age of respondent fishermen (in year) | 37.18 | 19 | 57 |
| Family size (in adult equivalent ratio) | 4.7 | 1 | 10.6 |
Table 2: Age and family size of sampled respondents.
In terms of marital status, about 80.2% of fishing households were married, while only 19.8% of households were unmarried. As data indicated in table 3, fishing households had experience that ranged from 3 up to 30 years with the average of 9.47 years in fishing activities. The majority of the respondent (58.14%) had fishing experience from 3 to 10 years, while 17.44% had a fishing experience of 11 to 15 years and 24.42% of fishing households had a fishing experience of 16 to 30 years (Table 3). This long year of experience in fishing helps to manage fishing activities properly from harvesting to marketing in order to benefit more income from the sector with better performances [12-14].
| Category | Indicator | Frequency | Percent |
|---|---|---|---|
| Marital status of household | Married | 138 | 80.2 |
| Unmarried | 34 | 19.8 | |
| Fishing experience | 03-May | 51 | 29.65 |
| (in year) | 05-Oct | 49 | 28.49 |
| Oct-15 | 30 | 17.44 | |
| 15-30 | 42 | 24.42 | |
| Fish consumption status | Regularly | 84 | 48.84 |
| When I do fishing | 79 | 45.93 | |
| Occasionally | 9 | 5.23 |
Table 3: Marital status, fishing experience and fish consumption status.
From the total fishing household 48.84% of sampled responds consume fish regularly, 45.93% when they do fishing activities and only 5.23% consume occasionally (Table 3). From the above result, it can be realized that as farmers participate in fishing activities, they consume more fish in their daily food items that directly contribute to the households’ food security, improvement in addition to income generation. Consuming fish is an important in human health, especially for young and old people due to its essential amino acids content, low cholesterol level compared to red meat and is easily digestible (FAO, 2014).
Socio-economic activities of fishing households
Land is considered to be a key fixed and the major productive asset in agrarian countries including Ethiopia. The mean of land size for the respondents were 1.3 hector with the maximum of 4 hectors (Table 4).
| Items | Mean | Minimum | Maximum |
|---|---|---|---|
| Land size (in hector) | 1.3 | 0 | 4 |
| Livestock holding (in tropical livestock unit) | 2.7 | 0 | 8.3 |
Table 4: Land size and livestock holding.
According to the assessment result, the majority of households (81.4%) gained land from their family by inherited. Overall, all fishing households (100%) were gained land from inherited and rented. The same results also indicate that about 54.95% households were certified their land (Table 5). As fo cus group discussant told that, land is used in multiple purposes including cultivation, sustaining livestock, storing wealth and providing collateral for financial credit [14-16].
| Items | Indicator | Frequency | Percent |
|---|---|---|---|
| Source of land | Inherited | 140 | 81.4 |
| Rented | 15 | 8.7 | |
| Inherited and rented | 17 | 9.9 | |
| Having green certificate | No | 91 | 45.05 |
| Yes | 111 | 54.95 |
Table 5: Source of land and certified of land.
On the study area, the sampled respondents were possess cows, oxen, heifers, calves, sheep, goats, poultry and donkeys that used them for their livelihood security. As male age of 35 focus group discussant Ato. Alemu Yadata said that, in the study area livestock is an essential for agricultural production, food and income generation directly or indirectly. Additionally, it is the important source of draft or traction power for cultivation of land in the study area for the majority of farmers. Overall, fishermen generate a mean income of 9188.25, 4407.14, 833.33, 5681.82 and 34697.44 EBT from selling crop production, livestock, Livestock product, and off/non-farm and fishing activities respectively (Table 6). So, from the collected data the study concluded that, the average income per household per year obtained from fishing was higher than other income sources [17].
| Characteristics | Frequency | Minimum | Maximum | Mean |
|---|---|---|---|---|
| Income from crop production | 57 | 1500 | 25600 | 9188.25 |
| Income from livestock | 7 | 2500 | 7700 | 4407.14 |
| Income from livestock product | 3 | 500 | 1000 | 833.33 |
| Income from off/non- farm | 11 | 2000 | 12500 | 5681.82 |
| Total income from fishing | 172 | 20000 | 55100 | 34697.44 |
Table 6: Mean income generated from different income source (multiple responses).
In the study area the animal product like Milk, Egg, Meat, Butter, Cheese and yogurt are not mostly used for market to generate household income. In focus group discussion the discussant clearly mention that, in the study area due to lack of animal feed the animal product is not enough even for home consumption [18].
Social participation and access to institution
As Table 7 show that all fishing household (100%) were belong to one to two social groups. In the study area fishing activities specially fish collector were done through making cooperative that had a license from government body. An individual who are non-member of those cooperative were seen as illegal fishermen. Those groups have not recognition to participate in fish collection from main water bodies Lake Koka. There were social groups which included credit, fish cooperative, Religious, farmers’ cooperative and informal institution (Idir, Ikub and Mehiber). Most farmers organized on land, squash and selling on construction row material (Selling beachy and Sandy soil). Those formal and informal institutions were mainly to provide credit facilities, that allow becoming fishermen and providing in kind and in cash support for family need in addition to grief and enrapture events.
| Variables | Indicators | Frequency | Percent |
|---|---|---|---|
| Access to training | Yes | 22 | 12.8 |
| No | 150 | 87.2 | |
| Social participation | Yes | 172 | 100 |
| No | - | - | |
| Credit access | Yes | 20 | 11.6 |
| No | 152 | 88.4 | |
| Purpose of using credit (N=20) | Purchasing fishing equipment | 4 | 2.3 |
| Purchasing agricultural input | 13 | 7.6 | |
| Purchasing livestock | 3 | 1.7 |
Table 7: Social participation and access to institution.
In the study area irrigation activities were done by individual farmers and other investor that mainly produce Onion and Tomato. This activity absorbs high human power during land preparation, planting and harvesting times. Additionally farmers also organized as Legal cooperative that function for the maximum of five years to do such activities as daily labors.
In rural area credit service is also one of the main institutions that provide access to finance for households to improve farm production and productivity. From the result only 11.6% of households were used this service (Table 7). Farmers with access to credit can minimize their financial constraints and able to buy the necessary fishing equipment more readily than those with no access to credit. According to discussion, some credit users were used the money to purchase agricultural inputs, livestock and fishing equipment’s.
Whereas, the survey result show that the majority of the farmers (88.4%) households were not using credit service at all. As focus Group discussant maintained that, the reason behind rejection of credit was due to high interest rate and short payback period in addition to lack of collateral, unsuitable lending process or strategies and lack of information about credit institution and its service were the main reasons that limited farmers from credit access.
As the collected data show that, from the total sample household only 12.8% of farmers were attained training related with fishery activities. A trained person will be an advantageous position than an untrained person in analyzing the socioeconomic phenomena and conducting fishing activities.
The Current status of fishing activities
Fishing source and Fish species diversity
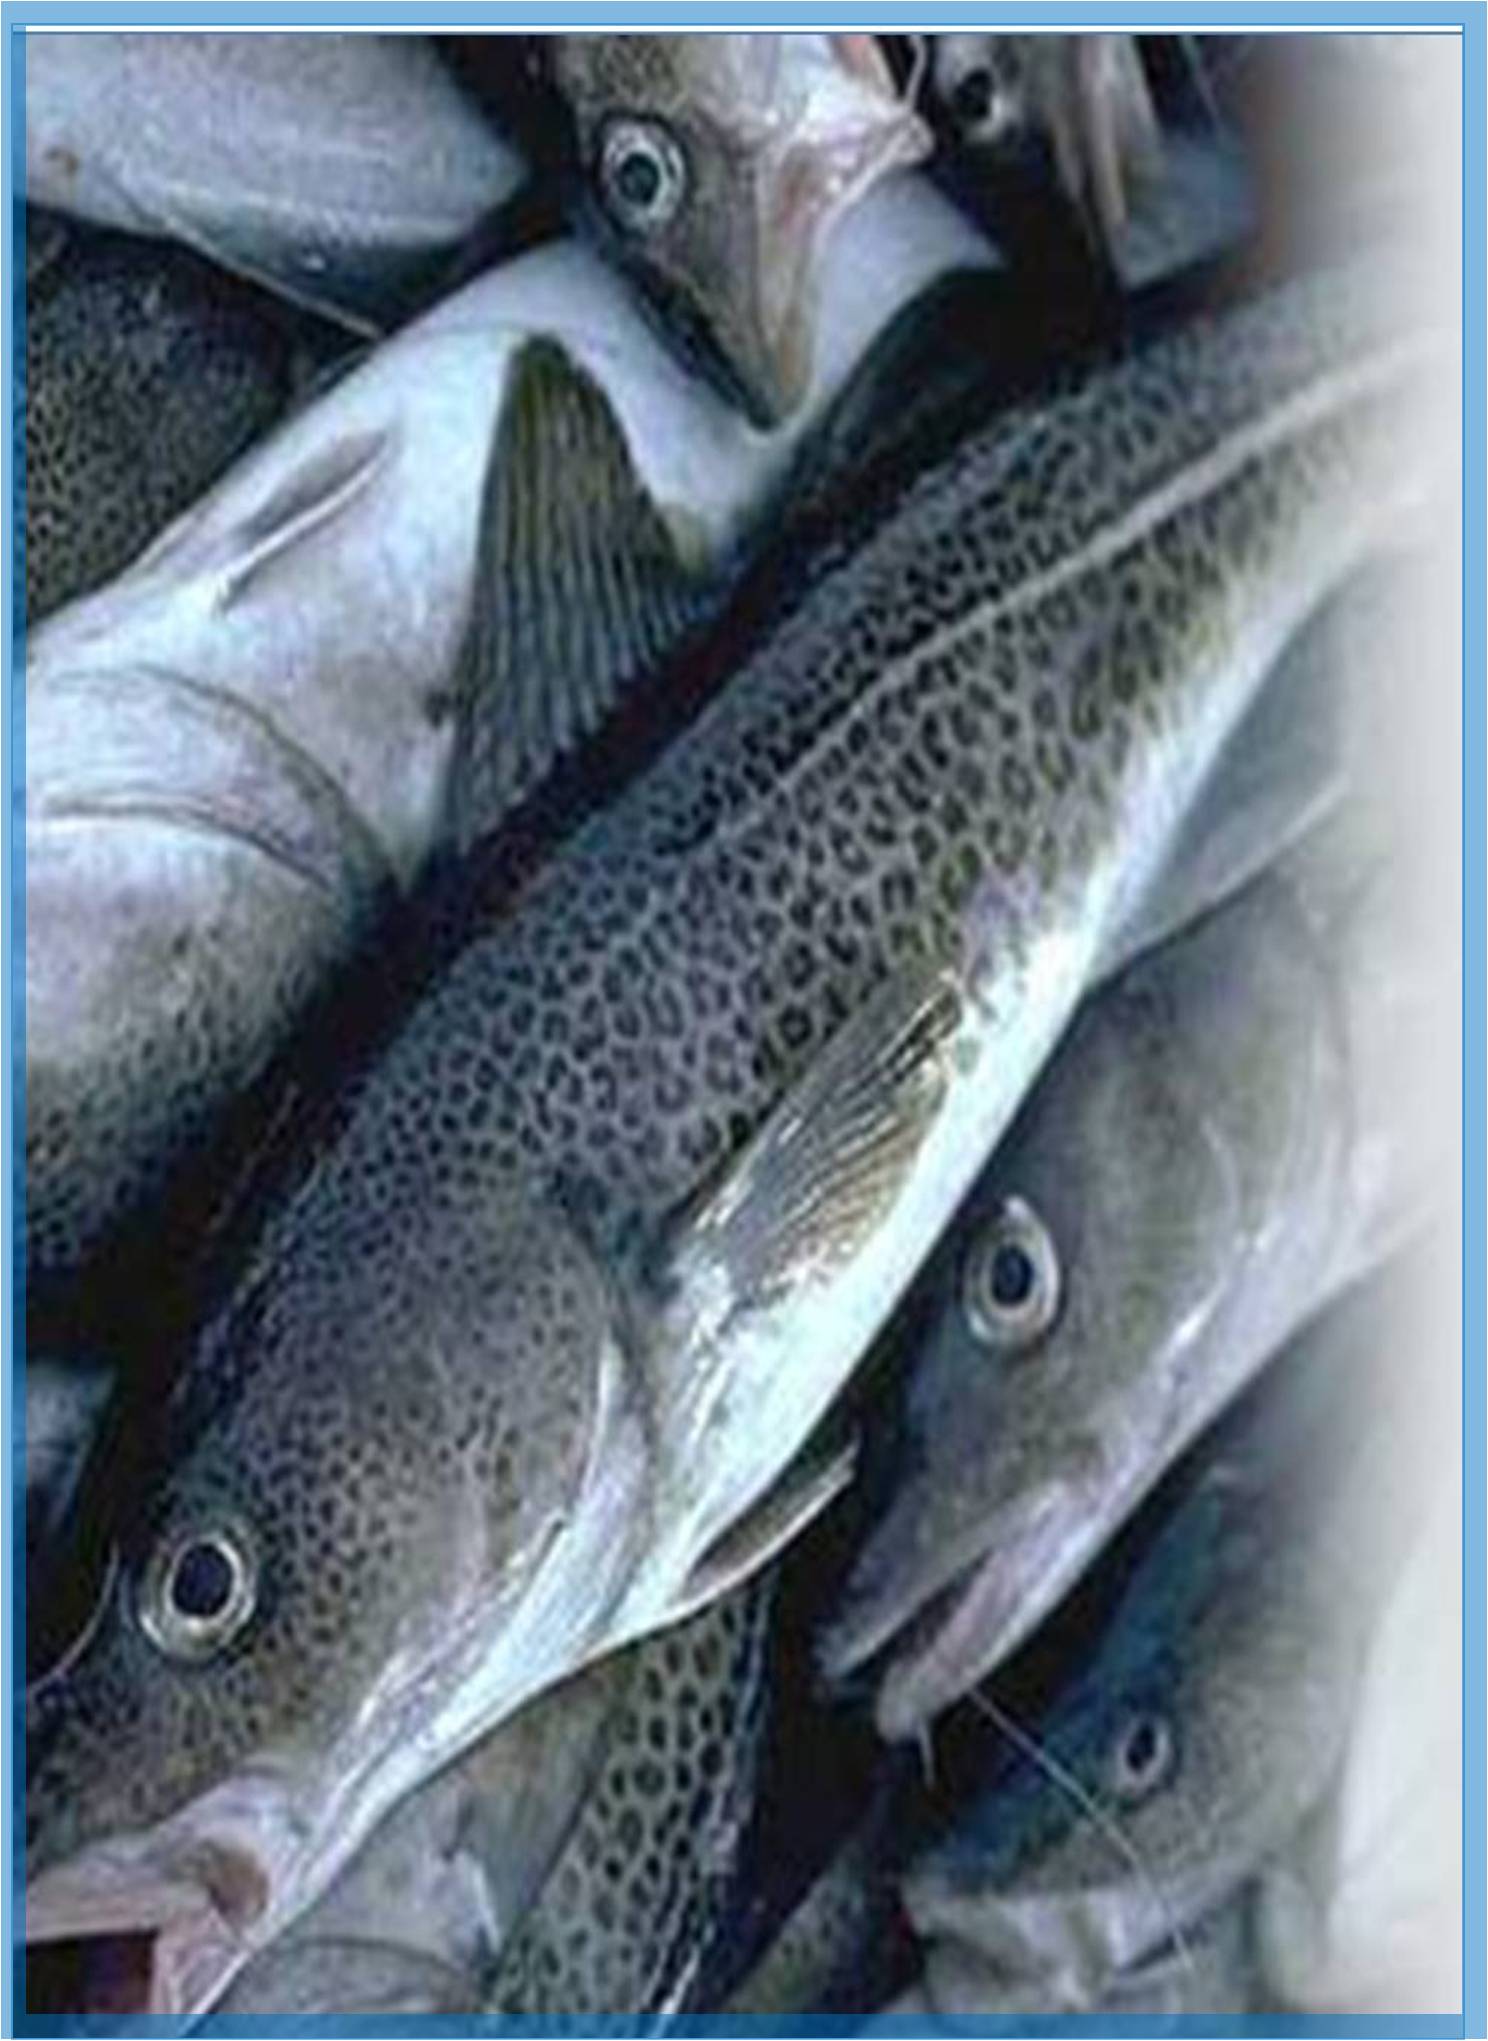
In the study area all fishing households were use Lake Koka for fishing purpose. During the assessment respondents mentioned the presence of only four species namely Nile tilapia (Oreochromis niloticus) (Figure 3a), Common carp (Cyprinus carpio) (Figure 3b), Catfish (Clarias gariepinus) (figure 3c) and Barbus (Labeobarbus intermedius) (Figure 3d) in their fish production. However, the survey result confirmed that among them Nile tilapia (Oreochromis niloticus), African catfish (Clarias gariepinus) and Common carp (Cyprinus carpio) were the main targeted and leading species in overall production.

Figure 2. Sex of the households.

Figure 3. Fish species targeted in Lume District at Lake Koka, January, 20/2020.
They also had more recognition by consumer and traders. These three species successfully colonize the Lake and are able to form different size classes indicating the species are well adapted the Lake environment. This is consistent with the finding of Tesfaye and Wolff, (2014) and Tesfaye et al. (2016) indicate that Oreochromis niloticus, Clarias gariepinus and Cyprinus carpio are the most principal fish species in Lake Koka.
Based on the assessment result, Barbus (Labeobarbus intermedius) fish species (Figure 2d) is out of production and not preferred in the market including active consumer. As male age of 32 key informant development agents from Dungugi Bekele Kebele Ato. Rorisa Kafani expressed that, the majority of fillet this fish species is inter-webbed by spiny bones that is not covetable to prepare any kind of food items and unsafe for consumption. When this fish species caught during fishing, all the fishermen retrieve to the lake immediately.
According to table 8, about 39.07% and 38.37 of sampled households were catching Nile tilapia and carp species from the lake in last production season. In other case about 22.56% of the fishing households were targeting to collect the cat-fish. From the figure the fish catch at Lake Koka was dominated by Nile Tilapia fish species. As my persona observation at landing site local consumers and traders were mostly find this fish species than others. Similarly, literatures show that Nile Tilapia (Oreochromis niloticus) is one of the most important fish species that are highly produced in capture fishery and aquaculture production in more than 100 countries (FAO, 2018): including Ethiopian that is predominantly targeted and the leading species caught and consumed in most fish producing areas (Vijverberg et al., 2012; Kebede et al., 2017).
This result was also similar with the finding of other researcher that was done in different part of fish potential area. Socioeconomic survey done by Samson (2015) shows that, in Lake Abaya from the total catch about 68% is represented by Nile Tilapia (Oreochromis niloticus). Bikila and Amanuel, (2016) also point out that Fincha Amarti Nashe Reservoir, Nile Tilapia was characterized by 75.06% from the all production by fishing households. As research done by Sai (2016) indicate that, in Lake Hawassa Nile tilapia (Oreochromis niloticus) are the most commercially abundant fish species that account 62.5% from total fish production.
Nature of fishing and major fishing activities
Fishing activities are done during morning and at night time in all landing sites of the study area. In the study area, all fishing activities were operated by non-motorized basis that were done in full time (68.6%) and seasonally (31.4 %) (Table 9). As female age of 30 focus group discussant from fishing household Mrs. Ababao Gabbisa specified that, fishing is commonly carried out mostly at the end of rainy season (starting from September) and continues to the beginning of the next rainy season (June). Based on the study result the majority of fishermen participate on fish collection and processing activities.
From the survey result 60% were undertaking fish collection activity only and 32.56% of the respondents from fishermen were undertaking fish collection and processing activities in the study area (Table 9). Other small proportion of the respondents were taking part on renting gears, fish trading, net making and mending in addition to collecting and processing. From sampled fishing households, 48.8% and 30.2 % were doing fishing with own labor and employs assistants respectively. In addition 20.3% respondents were employed by other gear owner fishing households. They workers have an agreement to share equally from the total daily production with gear owner.
Fishing gear in the study area
Table 8 shows that out of the total respondents of fishing household in this study area, about 73.8% of them had their own fishing equipment which they used to perform fishing activity for different purposes. Fishing materials are not adequately found in the district market and they were enforced to travel long distance to buy around Batu which is 70 km far from Lume district. However, the remaining 26.2% of fishing households had no own fishing gears. From these total households, the majority of them were employed by other fishing households and the others were undertaking fishing trough renting in fishing equipment’s from other gear owner farmers.
| Species | Common name | Local | Types of fish harvested | |
|---|---|---|---|---|
| name | Frequency | Percent | ||
| Oreochromis niloticus | Tilapia | Qoroso | 168 | 39.07 |
| Cyprinus carpio | Carp | Dube/Aba Samuel | 165 | 38.37 |
| Clarias gariepinus | Cat fish | Ambaza/Tukure | 97 | 22.56 |
| Barbus intermedius | Barbus | Bilcha | - | - |
Table 8: Scientific, common and local name and types of fish harvested (multiple response).
From the total fishing households about 42.05% and 42.42% owned wooden boat (Figure 4b) and gillnet (Figure 4a) respectively. The gill-net mesh size ranged from 6 cm to 8 cm with a maximum length of 200 by 200 meters. As male age of 28 key informant developments agent from Darar Denbela Kebele Mr. Hussen Kemal said that, except maintenance all fishing gears are not prepared by any group or organization around our residence.

Figure 4. Main fishing gears in the study area at Koka Lake, January, 20/2020.
In addition to this, about 9.47% and 6.06% of the sampled fishing households were using beach seine and hook respectively for fishing activities. In the study area fishing household were used long line hook that used for catching catfish and large size common carp fish species. Fishing gear gill-net and long line are passive which kept in the water and it catches those fishes which try to pass through the net set from deeper areas. As male age of 38 focus group discussant from fishing household Mr. Tabor Bariso stated that, unlike gill net, beach seine is mostly used in shallow area and it is not effective in deep site. Currently during data collection the majority of fishing households were used Gill net with wood boat. This study result is similar with previous finding of Tesfaye et al. (2016) in Lake Koka which reported that fish was caught with Gill-net, beach seines and hook (long line).
Reason for fishing and access to fishing technology
In the study area farmers participate in fishing activities for different reason. Accordingly, the majority of them were undertaking fishing as the main livelihood income source and home consumption. Generally, from the assessment result Table 9, it can be inferred that farmers engage in fishing activity to increase household income (19.77%), increase family consumption and minimize food shortage (12.43%), due to lack of other income source (11.86%) and to as source of employment (5.65%). Overall, the majority of farmers (82.48%) were participating in fishing activities for household income generation and used for home food consumption. This finding is in line with Asmare et al. (2017), Kakuru et al. (2013) and Asiedu (2012) who pointed out that fish is caught mainly for home consumption and income generation.
| Variables | Indicators | Frequency | Percent |
|---|---|---|---|
| Nature of fishing | Non-motorized | 172 | 100 |
| Condition of | Full time | 118 | 68.6 |
| Undertaking fishing | Seasonally | 54 | 31.4 |
| Fish collecting | 108 | 60 | |
| Major fishing | Fish collecting and processing | 64 | 32.56 |
| Activities (multiple response) | Renting gear | 2 | 1.11 |
| Fish trading | 3 | 1.67 | |
| Fish collecting, processing and enetting | 3 | 1.67 | |
| Condition of fishing | Work for him self | 84 | 48.8 |
| Employs assistants | 1 | 0.6 | |
| Work for himself and employs assistants | 52 | 30.2 | |
| Employed by other | 35 | 20.3 |
Table 9: Nature of fishing and major fishing activities undertaken in the study area.
In the study area only 2.33% of households were used the new information and technologies including utilizing recommended and appropriate fishing gears with good understanding sustainable fishing on lake management system. The remaining majority of fishing households (97.67%) were not supported fishing activities with new information and technologies. However, like other agricultural activities fishing also need to support with different information and technologies that come from the credible source at right time to ensure its significant impact on farm household livelihoods under increasing challenges. Access to accurate and adequate information on fishing production technologies by farmers is essential for increased fish production (Salau et al., 2014).
Fish marketing and selling
In the study area, there is no fixed market structure and fish landing place for fish products that was already established for selling fish. As survey result indicates, the majority of the fishing households sell fish at landing site to consumers and whole sellers. As indicated in Table 10-12 about 74.4% of the fishers sell fish at landing sites while 20.9% of sampled households were selling their product at landing site and village market. From the total fishing households about 96.5% of them were sold their product on landing site and at nearest village market for any consumers and whole sellers during morning section.
| Variables | Indicators | Frequency | Percent |
|---|---|---|---|
| Own fishing equipment | No | 45 | 26.2 |
| Yes | 127 | 73.8 | |
| Type of gear owned | Wooden boat | 111 | 42.05 |
| (multiple response) | Beach Seine | 25 | 9.47 |
| Hook (Longline) | 16 | 6.06 | |
| Gill net | 112 | 42.42 |
Table 10: Fishing equipment’s (gear) type operated in the study area.
| Variables | Indicators | Female | Male | Total | |||
|---|---|---|---|---|---|---|---|
| Freq. | % | Freq. | % | Freq. | % | ||
| Reason for fishing (multiple response) | Increase HH income | 6 | 17.14 | 29 | 20.86 | 35 | 19.77 |
| Increase family consumption and minimize food shortage | 3 | 8.57 | 19 | 13.67 | 22 | 12.43 | |
| Income and food source | 16 | 45.71 | 73 | 52.52 | 89 | 50.28 | |
| Lack of other income source | 5 | 14.29 | 16 | 11.51 | 21 | 11.86 | |
| Source of employment | 3 | 14.29 | 5 | 3.6 | 10 | 5.65 | |
| Access to fishing technology | Yes | 1 | 3.33 | 3 | 2.11 | 4 | 2.33 |
| No | 29 | 96.67 | 139 | 97.89 | 168 | 97.67 | |
Table 11: Access to fishing technology and reason for fishing.
| Variables | Indicators | Frequency | Percent |
|---|---|---|---|
| Place of fish selling | At landing (fishing) site | 128 | 74.4 |
| At village market | 2 | 1.2 | |
| At landing and village market | 36 | 20.9 | |
| At landing, village &district market | 6 | 3.5 | |
| Means of transportation | Human labor | 114 | 66.3 |
| Human & animal cart | 19 | 11 | |
| Motor bicycle | 10 | 5.8 | |
| Human & Motor bicycle | 29 | 16.9 | |
| Fish customer | Consumer | 23 | 13.4 |
| Whole sellers | 3 | 1.7 | |
| Consumer & whole seller | 146 | 84.9 |
Table 12: Fish marketing and distribution in Lume district (multiple responses).
In the study area, a few fishing households sell their fish at village and district market during high production and if not competed at landing site. However, during transportation of fish, households were not using any improved transportation facilities. As female age of 32 key informant development agents from Koka Negawo Kebele Mrs. Chaltu Abomssa mentioned that, fish is easily spoiled in short period after catching. Similar result show that fish is the most perishable food item especially in the tropical climates of developing countries which starts spoiling soon after death (Kumolu-Johnson and Ndimele, 2011).
The majority of fishing households were simply using any available container of polystyrene material for transporting fish until to reach market area by human labor (66.3%). The remaining 33.7% of fishing households were transporting their fish by motor bicycle and animal cart in addition to human labor. As male age of 32 development agents from Dhungugi Kebele Mr. Rorisa Kafani mentioned that, due to its perishable nature, when the fishing households face lack of market at landing site, they prefer to send their catch to family for consumption rather than looking other market options.
Currently, Lume district livestock and fishery offices contact fish trader who have license to do fishing business and link with all fishing household. The traders prepared transport and other necessary facilities by themselves and bought collected fish regularly. Regarding to the price of fish, all focus group discussant from fishing households mentioned that, the price was determined at district level with fishing households, Lume Livestock and Fishery Office and traders. Finally, based on their agreement the traders sign an agreement to buy harvested fish with fixed price at landing site on the morning time every day. According to the agreement, fish traders have the right to receive the bulk of the production at landing site. However, those fishing traders were mostly collected the fish from fishing households during high demand days and season.
Fish price in the study area also become flexible based on the demand of fish product especially during fasting time. According to female age of 42 focus group discussant from fishing household Mrs. Chali Dafaru specified that, fish demand is increased and high during Orthodox Christian fasting periods as well as fasting days in every week. Relatively large numbers of fishing gears are operated during this time. Due to its demand pattern the price also increase in those times in all landing site. During data collection it was also absorbed that, small restaurants open and prepare fish food in the village on Wednesday and Friday only when other animal meat is not consumed by Orthodox Religion followers.
Based on personal observation during survey time, before that critical time one kg of fish was sold in average for 25 ETB for whole tilapia and carp fish species, while 50-60 ETB for filleted African catfish. However, duringfasting time its price was increase to 45, 30 and 90 ETBfor whole tilapia, carp and filleted African catfishrespectively. The study result is similar with, Asefa (2013) that confirm demand is higher than supply especially, in Ethiopian fasting season with increasing fish price in the market. During this time the only allowed meat type is fish even if the price is high the supply is not enough for consumers. Lemma (2017), also reported that, fish demand is heavily weighted on fasting periods (55 days in March/April, 15 days in August) and two days in every week (Wednesdays and Fridays).
In fish market its price is determined based on fish species. Related to its marketing system, fish price in the market is estimated and sold based on the species of fish. Similar result that conducted by Alemu et al. (2014) reveal that in Guji and Borana zone the produced fish size and type of fish play an important role in the cost and price in the market. In the study area, fishing households mostly provide whole fish and gutted whole fish but rarely sold the filleted one that lead to low price at landing site. But during gutting and filleting time their processing methods was done on the ground or boat with low quality (Figure 5). This finding is similar with Ignatius and Zelalem (2011) that in central rift-valley lake fishermen were gutting or filleting in the shore of the lake with poor quality.
Fish production status

Figure 5. Fish processing methods in Lake Koka, January, 20/2020.
In the study area, fishing was used all year round with relatively high fishing activity during the Ethiopian Orthodox followers fasting period where the fish demand increases extremely. As male age of 37 focus group discussant from fishing household Ato. Tola Talila mentioned that fish production status was fluctuated even in different season in year due to water level variation and Lake Water turbidity. Figure 6 shows the trend of fish production status in Lume district from 2010 to 2019 and there has been fluctuation over the past ten years between 4500 and 7450 quintals. The sign of overfishing exceeding over 7792 quintals trough all landing site of the district per year has been recorded in last year 2015.

Figure 6. Fish production trend in Lume District.
Similar recorded data show that after 2017 the fish production status in the district was gradually increase. As male age of 28 key informant development agents from Darar Denbela Kebele Mr. Hussen Kemal mentioned that, fishing production in the study area was mostly fluctuated at different landing site. Due to this fishing household intensively move over the lake to increase the catchment level. Mr. Hussen Kemal also told that, currently the resource user fishing household farmers were have not conscious about the sustainability of fish catch and habitats conservation. As male age of 42 focus group discussant from fishing household Ato. Bashir Shibir were told as in fear about lake production status for the future and show good interest to accept any appropriate methods and strategies that will more improve lake fish production status.
In the study area all fishing households were used Koka Lake for fishing activities. In fishing activities Nile tilapia (Oreochromis niloticus), African catfish (Clarias gariepinus) and common carp (Cyprinus carpio) were the three species successfully adapted to the lake and becoming the main targeted species at all landing sites. The majority (92.56%) of them were undertaking fish collection and processing. Fishing activities on the study area is artisanal in its nature that performed during morning and at night by using wooden manual boat, active (beach seine) and passive gears (gill net, long-line). Related to fish marketing, there was no stable fish market in the area that most of the fishing households (96.5%) sell their product at the landing site or at the nearest village market for any consumer or trader arrived in the morning.
In the study area all fishing activities were operated by non-motorized basis with low market chain that performed at the shore line of the lake. Additionally, those participant households do simple fish processing; gutting and filleting on the ground or boat with low quality. Therefore, this practice should be improved through capacitating farmers by providing continuous training and supported by technologies. Moreover, all fishery research centers should work on producing new fishing technologies that help to facilitate the overall fishing activities. All concerned bodies, specifically district livestock development and fishery office should be use all efforts to create the convenient environment for fishing activities.
According to survey result, Labeobarbus intermedius fish species was found in the lake and mentioned by the majority of fishing households. However, this species has no any economic value in the market. So, to utilize the existing potential it needs to teach new processing methods and change the perception of communities’ trough training that will reduce consumer threat. Therefore, regional fishery research center and district livestock development and fishery office should conduct study on its utilization in order to create market demand that directly help to improve income status of fishing households.
I express my genuine gratitude to Ormia Agricultural Research Institute and Batu Fish and Other Aquatic Life Research Center for all supports for finalizing this research work. My equal and special appreciation goes to Mr. Amanuel Berhanu and Mrs. Birki Gurmessa for your all-important comments, suggestion and appreciation. I take the great opportunity to thanks all Development Agents, Experts and administrative bodies in Lume district that assisted me in data collection with commitment and dedication. I express my heartfelt gratitude to all fishing household around Koka Reservoir providing valuable time and necessary information for this research work.
[crossref] [google scholar] [pubmed]